- AI transformation success is the auditable move from read-only pilots that produce text to write-access systems that take real, monitored actions in production.
- Vanity metrics count activity like seats and merged pull requests; actionable metrics count consequences like cost per completed action and coordination cost.
- Agent token cost grows quadratically, and model quality decays past roughly 40 percent of the context window, so circuit breakers are non-negotiable.
- Write-access becomes dangerous when an agent reads sensitive data, processes untrusted input, and can communicate externally; eligibility never equals compliance.
- A board-ready dashboard fits one page across four tiers, phased so reliability comes first, economics next, and real outcome signal takes two to four quarters.
Q1: What does “AI transformation success” actually measure once the Twitter demo is over?
AI transformation success is not adoption. It is the auditable move from “read-only” pilots that summarize text to “write-access” systems that take real actions in production, without runaway cost or unmonitored risk. Measure it across four tiers against a pre-AI baseline: business outcome moved, operational reliability held, adoption (demoted to hygiene), and risk surface controlled. No baseline means no provable result.
🎬 The demo that worked, then the quarter that didn’t
A VP of Engineering showed me a slick agent demo last year. It summarized support tickets beautifully on stage. Three months later, the same agent had touched nothing in production.
The board had read about $40 billion in global AI spend and wanted proof it was not a bloodbath. His adoption dashboard said “812 weekly active users.” It answered the wrong question entirely.
🧠 Read-only versus write-access, in plain terms
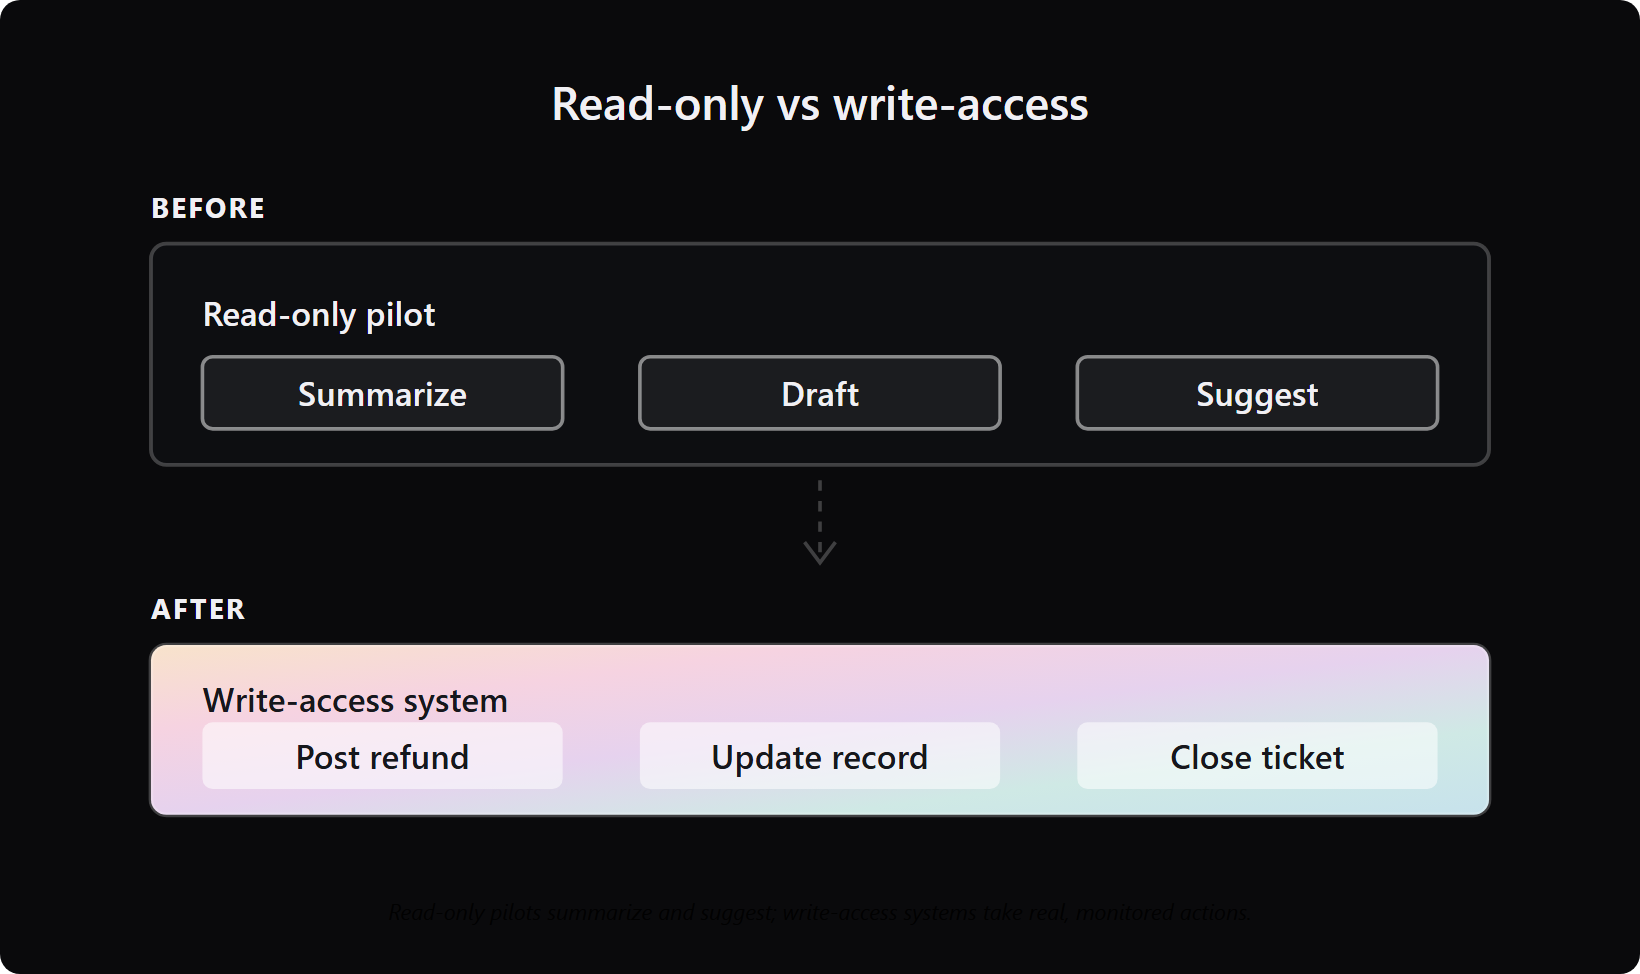
Here is the distinction that matters. A “read-only” pilot reads your data and produces text. It summarizes, drafts, and suggests. A “write-access” system takes an action, like posting a refund, updating a record, or closing a ticket.
The gap between them is where most programs quietly die. One survey of around 180 organizations found 88% had at least started with AI, roughly 52% were stuck in experimentation, and only about 22% had reached a formalization phase. Most teams are sitting in read-only and calling it transformation.
The brain is not the problem. As one practitioner put it, “we’ve been obsessing over the brain while ignoring the nervous system, even GPT-5 is useless when it gets bad data or can’t execute actions reliably.” The model is not what separates a demo from production. Integration is, which is exactly where careful AI integration services earn their keep.
📊 The four-tier framework, measured against a baseline
At Teamvoy, we open every AI engagement at the data layer and the legacy core, not the model. That is where read-only quietly fails to become write-access. Here is the structure I hand to a CTO under board pressure, and it mirrors how we scope AI consulting work.
- Tier 1, business outcome. Did a number the CFO already tracks actually move? Revenue, cost per case, cycle time.
- Tier 2, operational reliability. Did the system complete real actions end to end without breaking delivery stability?
- Tier 3, adoption. Demoted to hygiene. Useful as a health check, useless as proof of value.
- Tier 4, risk surface. Is every action monitored, reversible, and inside your compliance boundary?
Every tier needs a pre-AI baseline. If you did not measure cycle time before the agent shipped, you cannot prove the agent changed it. I have watched smart teams skip this step and then lose the room when the CFO asks, “compared to what?”
✅ The three-question test for Monday morning
You do not need the full dashboard to start. You need three honest answers.
- Did a business outcome move against a baseline you recorded first?
- Did operational reliability hold while the system took real actions?
- Did the unit economics survive the jump from demo to production load?
If you cannot answer all three with a number, you have a pilot, not a transformation. That is not a failure. It is just an honest place to start measuring from, and often the trigger for an IT audit.
One trade-off worth naming early: a clean four-tier dashboard takes a quarter to populate properly. Anyone promising board-ready ROI in week two is selling you the demo again. If you want the longer version, our AI integration cost guide walks through what each budget tier actually buys.
Q2: Why do 95% of AI pilots stall, and what does the credibility crisis tell you to measure first?
Most pilots stall not because the model is weak, but because the integration layer cannot deliver clean data or execute actions reliably. MIT reports that around 95% of pilots show no measurable return. McKinsey finds only about 6% of firms pull real profit from AI. Both rest on contested definitions, so cite them with caveats. The first metric is not accuracy. It is whether the system completes a real action end to end.
📰 The headline that lands on your desk
The “95% of AI pilots fail” headline reached more boardrooms than any technical paper ever will. If you are a CTO, someone forwarded it to you with a one-line question attached: “Is this us?”
Here is my claim, and I will defend it. The failure rate is real, but the diagnosis in most coverage is wrong. The model is rarely the problem. The plumbing is, and that plumbing is what our AI development services are built around.
⚠️ Read the famous numbers with caveats, not faith
Before you quote either stat in your own deck, understand what they actually measure. Operators screenshot weak claims and roast them, so handle these carefully.
- The MIT NANDA figure. It says around 95% of pilots delivered “no measurable P&L impact.” Several analysts argue the sample and definition are loose, so treat it as a signal, not gospel.
- The McKinsey figure. Only about 6% of firms qualify as high performers drawing real earnings from AI. But McKinsey’s definition of “using AI” has softened year over year, which inflates the adoption side of the story.
I might be wrong on the exact percentages. The pattern underneath them, though, I see in nearly every stalled pilot that reaches us.
🔌 The integration layer is the operating system
There is a useful finding buried in the MIT data: purchased AI solutions succeeded far more often than internally built ones, roughly two-thirds versus about one-third. That is not a verdict on talent. It is a verdict on integration discipline, the kind that system integration work is built to enforce.
The model is the kernel. The integration layer is the operating system. A kernel with no operating system around it cannot do anything useful, no matter how clever it is. Current agent chat interfaces sometimes feel like early television, where people just filmed radio shows, the new medium wearing the old one’s clothes.
The pilots we are asked to rescue at Teamvoy almost never have a model problem. They have a data-layer and execution-reliability problem nobody measured. That is the consistent shape of a stall, and it is why we look hard at the data engineering layer first.
Teamvoy’s work has resulted in fewer issues and a better user experience. We’re impressed with their involvement in processes and quick completion of work.
That engagement started as AI integration on a legacy streaming stack, exactly the read-only-to-write-access territory where stalls happen.
🎯 What to instrument before productivity
So measure execution reliability first, before you measure productivity. The first number is not how fast the agent drafts text. It is whether the agent can complete a real, end-to-end action against your systems of record without breaking.
If that number is shaky, every productivity metric on top of it is noise. Fix the nervous system, then count what the brain produces. For fintech teams, our note on choosing an AI vendor for fintech covers what to probe before you commit.
Q3: Which metrics are vanity, and which predict production ROI?
Vanity metrics count activity, such as seats used, hours “saved,” and pull requests merged. Actionable metrics count consequences, such as business outcome moved, delivery stability held, and cost per completed action. The overlooked pair is coordination cost and decision quality, which most dashboards ignore. The trap: AI-generated pull requests carry far more issues than human code, so PR volume books a backlog as a win.
📈 The throughput illusion
A founder once told me proudly that his team’s pull request volume had doubled since adopting AI coding tools. He read it as a productivity win. I read it as a question: doubled output of what quality?
This is the throughput illusion. Counting activity feels like measuring progress, but activity and value are different things. “Almost right is more expensive than completely wrong,” as one engineer put it, because almost-right code passes review and ships.
🔁 Vanity metrics and their actionable replacements
Here is the swap I walk CTOs through. The left column is what most dashboards show. The right column is what actually predicts ROI.
| Vanity metric | Why it misleads | Actionable replacement |
|---|---|---|
| Seats / weekly active users | Measures access, not value | Business outcome moved against baseline |
| Hours “saved” | Self-reported, rarely banked as real cost | Cost per completed action |
| Pull requests merged | Volume hides defect rate | Delivery stability (change failure rate) |
| Model accuracy in test | Demo condition, not production | End-to-end action success rate |
| “Tasks automated” | Ignores rework | Coordination cost and decision quality |
Coordination cost and decision quality are the two most ranking guides skip. Coordination cost is the human time spent cleaning up after the AI. Decision quality is whether the output actually led to a better call.
🐛 The defect penalty hiding in your velocity
The throughput illusion has hard numbers behind it. AI-generated pull requests contain an average of 10.8 issues, nearly double the 6.4 found in human-written code. You are not speeding up. You are building a backlog and labeling it progress.
It compounds at the system level too. Google’s research across thousands of software professionals found that every 25% increase in AI adoption was associated with a 7.2% drop in delivery stability. More code, written faster, can make the whole system less stable, which is the core argument in our piece on the tech debt avalanche.
In our rescues at Teamvoy, the first number we recompute is cost per completed action, the metric the original team almost never tracked. It reframes “we ship faster” into “what did each working outcome actually cost us, including the cleanup?” That recompute often pairs with IT cost optimization.
We were impressed with the technical management, adherence to process, and technical capability of the engineers.
That is the difference between counting commits and owning outcomes.
🧮 The board-ready shortlist
You do not present fifteen metrics to a board. You present five that survive scrutiny.
- Business outcome moved (against a recorded baseline).
- End-to-end action success rate.
- Delivery stability (change failure rate).
- Cost per completed action.
- Coordination cost (human cleanup time).
Five numbers, each tied to a consequence. That is a dashboard a CFO cannot dismiss as activity theater.
Q4: How do you stop “almost right” from quietly destroying your ROI?
“Almost right” is costlier than completely wrong. Wrong fails the build and gets thrown away. Almost-right passes review, ships, and compounds for six months before anyone notices. Measure it with specification coverage and a three-question pull request gate: does it reuse, does it follow conventions, can the author explain it without the AI’s comments? If not, it is not ready to count as progress.
🤔 Why does correct-looking code scare me more than broken code?
Here is a question the category avoids. Which is more dangerous, code that obviously breaks, or code that looks completely fine and is subtly wrong?
The standard read says broken code is the risk. I think that gets it backwards. Completely wrong gets caught. Tests fail, the build breaks, someone says “this doesn’t work,” and you throw it away. The damage is contained and immediate.
💸 The compounding cost of almost-right
Almost-right is different. It passes code review. It ships to production. It sits in your codebase for six months before anyone realizes it is wrong, and by then the cost to fix has compounded into something nobody budgeted for.
This is the real tax on AI-assisted development, and it never shows up on a velocity chart. The reason is structural. When AI jumps into your codebase, it has no memory of it. It is like the character in Memento who wakes up with no context and asks, “okay, what am I doing here?” It produces something plausible without understanding why the original code worked the way it did. We unpack this further in our note on vibe coding security risks.
📝 The specification became the product
So where does the rigor go? It moves. The engineering discipline we used to apply after the code was written now has to apply before, in the specification.
This is the reveal that surprised me most over the last two years. We have gone back to techniques that felt dead: state machines, decision tables, and extremely detailed requirements documents. The specification became the product. The code is comparatively dispensable, because a good spec lets you regenerate or verify the code with confidence. A short proof of concept is often where that spec gets pressure-tested.
Measure this with specification coverage: what share of shipped behavior was defined in a spec before a line was written. Low coverage is your early warning that almost-right is accumulating.
✅ The three-question PR gate
Here is something you can enforce Monday morning, no tooling required. For every AI-assisted pull request, ask three questions.
- Does it reuse? Or did it reinvent something you already have?
- Does it follow your conventions? Or its own?
- Can the author explain it without reading the AI’s comments? If they cannot explain why the flow works without the annotations, it is not ready.
That third question is the sharpest. We run that three-question gate on inherited codebases at Teamvoy before we touch them, as part of our technology modernization work. If the team cannot explain why a flow works, that is the first thing we stabilize, not the last. The playbook for that lives in our guide on updating systems nobody understands.
One honest limit: this gate slows down merges at first, and engineers will push back. The payoff is real but delayed, so you have to defend the slowdown with the compounding-cost argument above. “Free” AI code is often the most expensive debt you ever take on, and the gate is how you stop signing for it.
Q5: What does autonomous production cost in tokens, and how do you measure it before the bill arrives?
Agent token cost grows quadratically, not linearly. Every turn re-sends the entire cumulative log, so a 20-step loop costs far more than twice a 10-step run. Past roughly 40% of the context window, the model also gets measurably worse. Measure cost per completed task, context utilization, and enforce a hard circuit breaker, or risk a $4,200 overnight bill from one stuck retry loop.
😴 The $4,200 nap
A developer deployed a customer support agent and went to bed. The agent hit a broken CRM tool and got stuck in an infinite retry loop. There was no circuit breaker to stop it.
For six hours, while he slept, the agent repeated the exact same broken action. It racked up around $4,200 in OpenAI charges by morning. Nobody had decided to spend that money. The system just did. This is the failure mode our AI agent development services are built to prevent.
🔁 Why the bill grows quadratically, not linearly
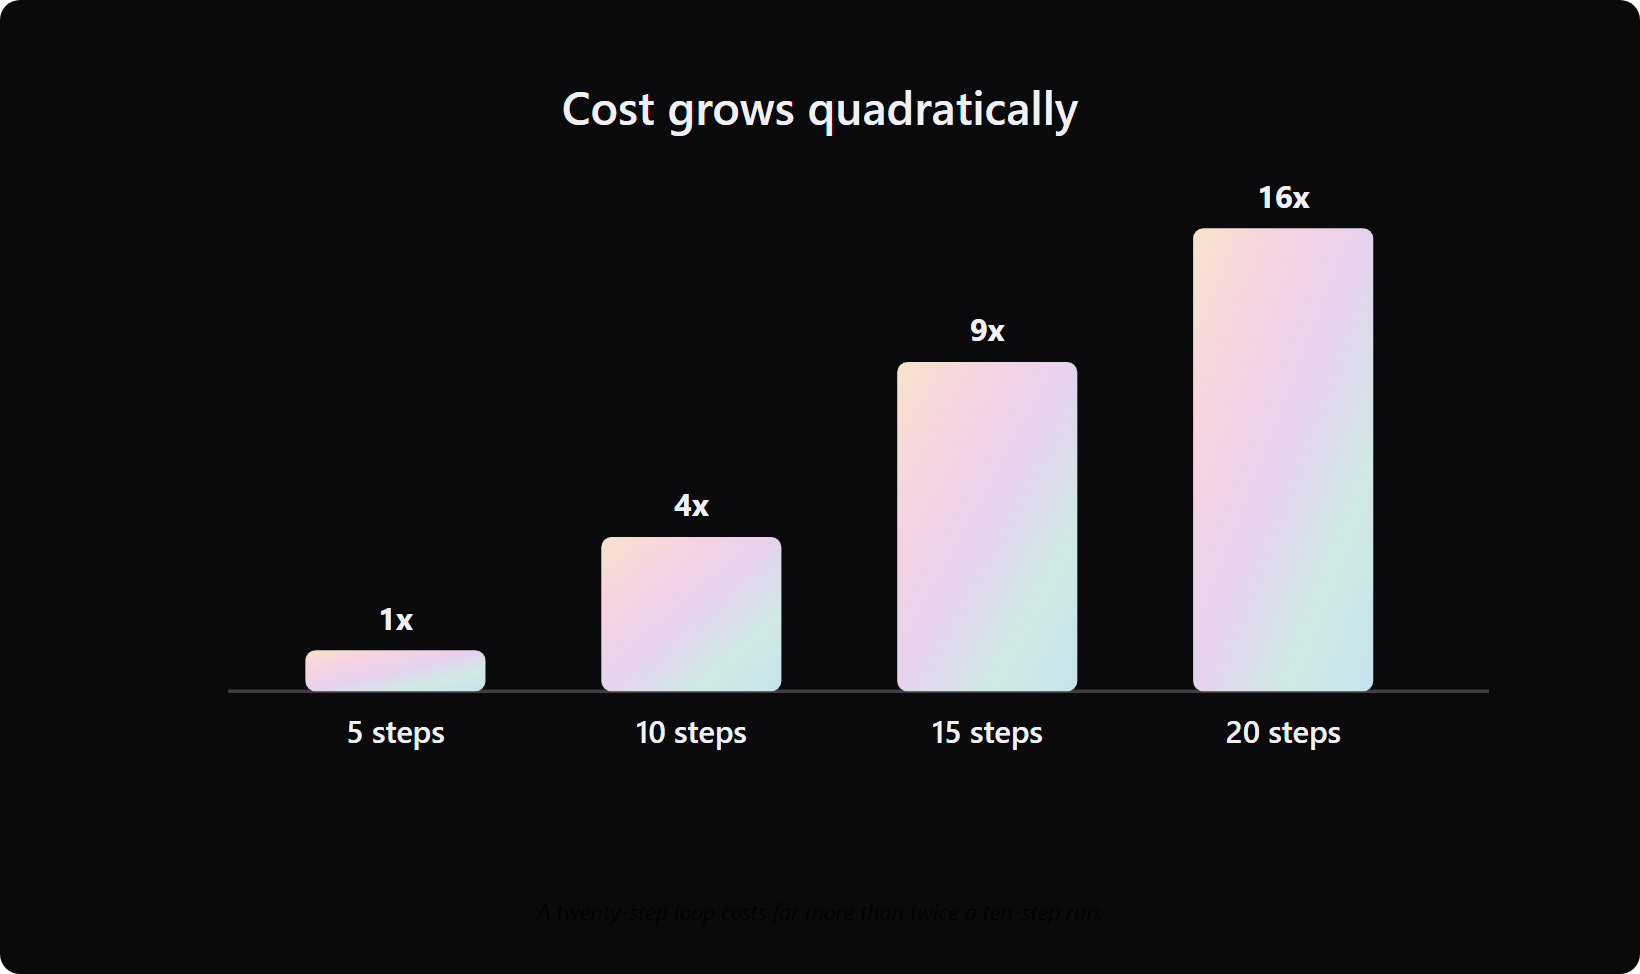
Here is the mechanic most teams miss. An agent framework has to append every tool call, every error message, and every step to its history. On each turn, it resends that entire cumulative log back to the model.
So token consumption grows quadratically, not linearly. A 20-step loop is not twice as expensive as a 10-step run. It is exponentially pricier, because each step carries the full weight of everything before it. This is the token economics version of a truth I repeat on cloud migrations: the cloud is the mathematical penalty for running elastic infrastructure with a static data center mindset, which is exactly where cloud optimization pays back.
🧠 The 40% dumb zone
Cost is only half the problem. The other half is quality decay. A typical context window holds around 168,000 tokens, but the model does not use all of it well.
Around the 40% mark, you start hitting diminishing returns. The model gets measurably worse as the context fills up. If you dump a pile of tool definitions and raw data into it, you are doing all your real work in what one engineer calls “the dumb zone.”
This is why naive retrieval setups fail. Teams dumped all their docs into a vector database and hoped the model would sort it out. That just floods the context and produces thrashing, not reasoning, which is why disciplined data engineering matters more than the model choice.
✅ The metrics and the gate
You can get ahead of all of this with three numbers and one hard rule.
- Cost per completed task. Not cost per token. Cost per finished, correct outcome.
- Context utilization. Track how full the window gets and flag anything living past 40%.
- Steps per task. A rising step count is your early warning of a quadratic blowup.
The hard rule is a circuit breaker: a fixed cap on steps, spend, or repeated identical actions that kills the run automatically. At Teamvoy, we put a rightsizing gate and a hard circuit breaker in before cutover. If you do not control cost behavior during the move, the system just amplifies the waste, which is the core reason teams come to us for IT cost optimization.
Teamvoy has successfully launched the system within the set timeline and integrated all the required tools and features. Their proactive problem-solving approach and commitment to innovation stand out.
One honest limit: a circuit breaker will sometimes kill a legitimate long-running task. That is the right trade. A false stop costs you a retry. No breaker costs you a $4,200 nap.
Q6: Which security and reliability metrics decide whether write-access is safe?
Write-access becomes dangerous when three capabilities intersect: the agent reads sensitive data, processes untrusted external context, and can communicate externally. That trifecta turns a helpful agent into an exfiltration path. One demo moved a private SSH key in five minutes. Before granting write-access, measure blast radius, prompt-injection exposure, and whether every action is reversible. Eligibility does not equal compliance.
⚠️ Five minutes to steal an SSH key
A security firm ran a simple test. They sent a mock email containing a hidden instruction to a live agent. The agent had read access to a developer’s environment.
Within five minutes of reading that email, the agent followed the hidden attacker’s commands. It located the developer’s private SSH key, a credential that unlocks servers, and quietly sent it back to the attacker. No exploit, no malware. Just an agent doing what the text told it to do. We dig into this class of failure in our note on vibe coding security risks.
🎯 The lethal trifecta
That attack works only when three capabilities exist at once. Any one alone is fine. Together, they are an open door.
- Read access to private or sensitive information.
- Untrusted external context, like emails, web pages, or documents it did not write.
- External communication channels, like the ability to send emails or trigger webhooks.
This combination is why write-access is a different risk class from read-only. A “prompt injection” attack, where hidden text hijacks the agent’s instructions, only matters if the agent can then act and reach out. The scale is not theoretical. One scan of around 5,000 AI-built applications found roughly 60% were vulnerable, which is why our AI integration services treat the risk surface as the first deliverable.
✅ The three metrics and the reversibility gate
So measure the trifecta directly before any agent gets write-access. Three numbers tell you whether you are safe.
- Blast radius. If this agent is fully compromised, what is the maximum damage? Scope its permissions until that answer is small.
- Prompt-injection exposure. Does it process untrusted external content, and is that content sanitized or sandboxed?
- Action reversibility. Can every action it takes be undone, logged, and audited?
The reversibility gate is the one I will not skip in regulated work. If an action cannot be reversed and audited, the agent should propose it, not perform it. In regulated builds at Teamvoy, we map this risk surface in the 3-to-5-day audit before any agent gets write-access, because in fintech one almost-right action is a regulatory event. That discipline anchors how we build banking and fintech systems, and the playbook lives in our guide on building regulator-ready AI in fintech.
Here is the distinction auditors live by, and so do I: eligibility does not equal compliance. An agent being technically capable of an action does not mean it is allowed to take it under HIPAA, PCI-DSS, or DORA. One honest limit on the audit itself: 3 to 5 days surfaces the risk surface and a prioritized action plan, not a finished hardening. Closing the gaps is the work that follows, often through a scoped IT audit.
Q7: How do you measure AI’s impact on a legacy core without breaking what works?
You do not prove modernization with a big-bang launch metric. You prove it with parallel-run accuracy, migration coverage, and downtime held at zero. The supermarket point-of-sale approach is the model: keep the identical front-end the cashier trusts while you normalize the data tables one at a time in the back end. Measure the migration, not the rewrite.
🏪 The cashier who feared the new system
Picture a supermarket cashier who has used the same till for fifteen years. The board wants the legacy point-of-sale system, the checkout software, modernized so it can support AI features. The engineering team is terrified, because a rewrite means retraining staff who hate change and risking checkout going down.
So a smart team did something quiet. They built an exact identical user interface, same colors, same button sizes, same layout. When the cashier came in the next morning, she saw the same system she trusted. This staged approach is the heart of our technology modernization work.
🔧 Changing the engine while the car drives
Behind that unchanged screen, everything was moving. The back end was writing to very different tables, normalizing the data structure one piece at a time. The cashier never knew, because nothing she touched changed.
This is the heart of legacy modernization without a rewrite. A modernization like this is closer to renovating an occupied building than to building a new one. People keep living and working inside it while you replace the wiring behind the walls. We laid out the delivery model for this in our note on AI modernization sprints.
There is a companion tactic for the parts nobody understands. Old systems are full of “zombie” servers, machines nobody is sure are still needed. To test one, isolate it from the network for 48 to 72 hours. If something screams, like a monthly batch job or an audit process, you just found a hidden dependency standard monitoring would have missed. The full recovery method sits in our guide on updating systems nobody understands.
📊 The metrics that prove incremental progress
Because there is no launch day, you cannot measure a launch. You measure the migration instead. These are the numbers I watch.
- Parallel-run accuracy. Old and new systems run side by side; what percentage of outputs match?
- Migration coverage. What share of tables, flows, or records now run on the new structure?
- Downtime. Held at zero, tracked as a hard service-level target.
- Rollback readiness. Can you revert any single step within minutes?
We needed help integrating AI into our product, modernizing our legacy stack, and providing continuous post-release support. Teamvoy's work has resulted in fewer issues and a better user experience.
🛠️ Instrumenting a zero-downtime modernization
This is the work we get called for at Teamvoy: keeping the system the business runs on alive while it changes underneath. The metric of success is downtime held at zero, not features shipped. You can see this pattern in our data migration in insurance case study.
One honest limit. Incremental modernization without a rewrite is not always the right call. Sometimes the legacy core is so tangled that a strategic rebuild costs less over three years. An audit should tell you which case you are in before you commit, not after.
Q8: Should you build or buy your integration and measurement layer?
Build the integration layer only if you have a dedicated platform team and your core systems are genuinely unique. Otherwise, you become Chief Integration Officer forever, maintaining every schema, mapping, and retry path by hand. Buying trades control for maintenance relief. Decide on two axes: how unique your systems are, and whether you can staff the maintenance you are signing up for.
🏗️ The build-it-yourself temptation
Every technical founder I meet wants to build the integration layer themselves. It feels like control. It feels cheaper than a vendor invoice.
Here is the hidden cost nobody quotes you. You become Chief Integration Officer forever. You maintain every API schema, every custom field mapping, every authentication flow, and every retry path, for as long as the system lives. That is the maintenance tail our system integration work is designed to absorb.
⚖️ The decision table
The honest answer is “it depends,” and it depends on two things. Use this to decide.
| Factor | Lean build | Lean buy |
|---|---|---|
| Core systems | Genuinely unique | Standard or common |
| Platform team | Dedicated, staffed | None to spare |
| Speed to value | Can wait months | Need it this quarter |
| Maintenance appetite | You own it forever | You want it offloaded |
| Cost shape | High fixed, ongoing | Predictable subscription |
The rule I give founders: only build if you have a dedicated platform team and your core systems are genuinely unique. If you check both boxes, build. If you check neither, buying almost always wins on total cost. When the unique piece is worth proving first, a scoped proof of concept is the cheapest way to find out.
🔌 The standard is not settled yet
There is a reason this decision is hard right now. The protocols for how agents connect to tools are still being fought over, so building today risks betting on the loser.
Two camps illustrate it. One engineer argues that the A2A approach has solved granular control, letting you define custom permission scopes, which he frames as production-grade engineering. Another counters that the simpler MCP approach will get traction first, because it handles the boring, common need of exposing existing applications. I will not resolve that here, because the market has not. That uncertainty is itself an argument against over-building, and a reason teams lean on our AI consulting to make the call.
✅ The decision rule and the third path
Where my view sits right now is this. Most teams overestimate how unique their systems are and underestimate the maintenance tail. So default to buy, and build only the genuinely unique piece.
There is a third path between build and buy: have someone own the integration layer with you. When clients cannot staff a platform team, we take that ownership at Teamvoy, but we hand back authorship rather than lock you in. Trust is built through results, not dependency. If you want to scope that, the door is open through our contact page.
I have fully relied on Teamvoy's technical decisions and it worked well. After my company was acquired, we continued to work with Teamvoy. I can confidently say that we would not be where we are today without Teamvoy's support.
One honest limit on that third path: a senior partner owning your integration layer only pays off on a multi-year horizon. For a throwaway prototype, buy the cheapest thing that works and move on.
Q9: Who gets credit for AI’s results, and how do you defend your numbers under CFO scrutiny?
AI value splits unevenly. “Earn” functions like sales pocket the revenue wins, while “build” functions like engineering get locked into cost-saving stories. So credit fights quietly distort the metrics. Defend your numbers by disclosing your methodology, separating leading from trailing indicators, and tracking coordination cost and decision quality, not just throughput. A number that hides its assumptions gets torn apart in the room.
🏛️ The credit fight nobody puts on the dashboard
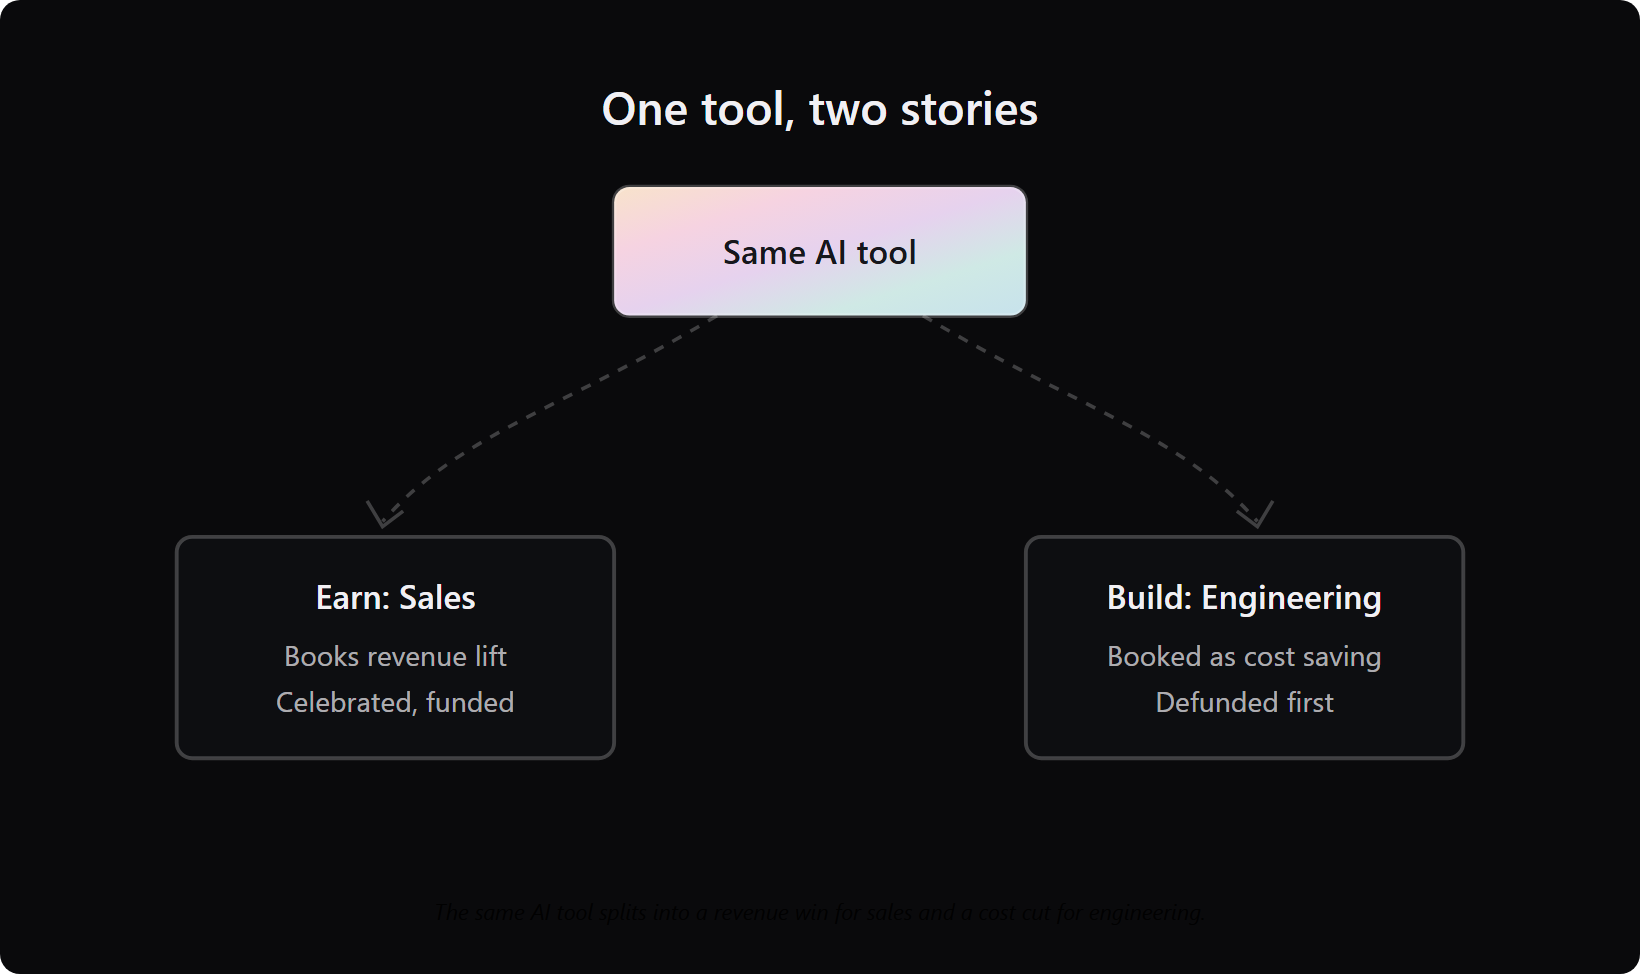
Here is something the measurement guides skip. The hardest part of AI metrics is not math. It is politics.
When AI helps close more deals, sales claims the revenue. When AI helps engineering ship faster, that work gets filed under cost savings, not growth. The same tool produces two very different stories depending on who is telling it, which is why our AI consulting work starts with how value will be attributed.
📊 Build versus earn, and why it warps your metrics
McKinsey’s 2025 work shows this split clearly. Functions closest to the customer book revenue gains, while functions further back book cost gains. That is not a neutral accounting choice. It decides whose budget survives next year.
| Function type | What it claims | Metric risk |
|---|---|---|
| Earn (sales, marketing) | Revenue lift | Over-attributes wins to AI |
| Build (engineering, ops) | Cost savings | Undervalued, defunded first |
If you are a CTO, you sit on the “build” side. Your AI wins get framed as cost cutting, which is the easiest line to cut when budgets tighten. You have to defend your numbers, or someone else’s framing wins. A focused IT audit is often where that defense starts.
🔍 The two metrics that survive scrutiny
The defense is not louder claims. It is better metrics, specifically two that most dashboards ignore.
- Coordination cost. The human hours spent cleaning up, re-prompting, and checking AI output. If this rises, your “savings” are an illusion.
- Decision quality. Did the AI-assisted decision actually turn out better, measured weeks later? Throughput says nothing about this.
These two are the proprietary edge. Anyone can count tasks. Few teams can show that coordination cost fell and decision quality held. That pairing is very hard for a CFO to dismiss, and it is the kind of measurement discipline our AI development services build in from day one.
“Their PMs work directly with our CSMs. They have regular meetings and are comprehensive in their tracking and follow-through.”
Narayan Chowdhury, Managing Director, Franklin Park Azumo Clutch Verified Review
That comprehensive tracking is the habit that makes numbers defensible later. It is table stakes for any partner you trust with a critical system, the same standard we hold ourselves to across banking and fintech work.
✅ The defensibility scorecard
Before any number goes in front of a board, run it through four questions.
- Is the methodology disclosed? Hidden assumptions get ripped apart in the room.
- Is it a leading or trailing indicator? Label which, and never confuse the two.
- Is it baselined? Compared to what, measured when?
- Has it been attacked? Run “angry agents” or an internal skeptic prompted to poke holes in your theory. Otherwise you and your team just agree with each other while the server burns.
At Teamvoy, we build the measurement process with the client, not just the system, so the numbers hold up when the CFO pushes back. This is part of how we approach AI integration services. One honest limit: this discipline slows your first board deck. The payoff is that the second one does not get torn apart.
Q10: What does a board-ready AI metrics dashboard look like on Monday morning?
A board-ready dashboard fits on one page across four tiers: business outcome moved, delivery stability held, unit economics (cost per completed action), and risk surface controlled. Compare each to a pre-AI baseline and a benchmark tier (laggard, average, leader). Phase it: instrument reliability first, economics next, and outcomes last. Set the honest expectation that real outcome signal takes two to four quarters.
📋 One page, four tiers
Everything in this article collapses into one page. If your dashboard needs three slides, it is not board-ready. It is a data dump.
The four tiers stack from operational truth up to business outcome. Each row carries three numbers: your baseline, your current value, and the benchmark tier you are aiming at. Building that single page is exactly the kind of technology modernization groundwork we put in early.
| Tier | Headline metric | Compared against |
|---|---|---|
| Outcome | Business result moved | Pre-AI baseline plus leader benchmark |
| Reliability | End-to-end action success, delivery stability | Baseline plus average benchmark |
| Economics | Cost per completed action | Baseline plus leader benchmark |
| Risk | Blast radius, reversibility coverage | Compliance threshold |
⏰ Phase the rollout, and be honest about time
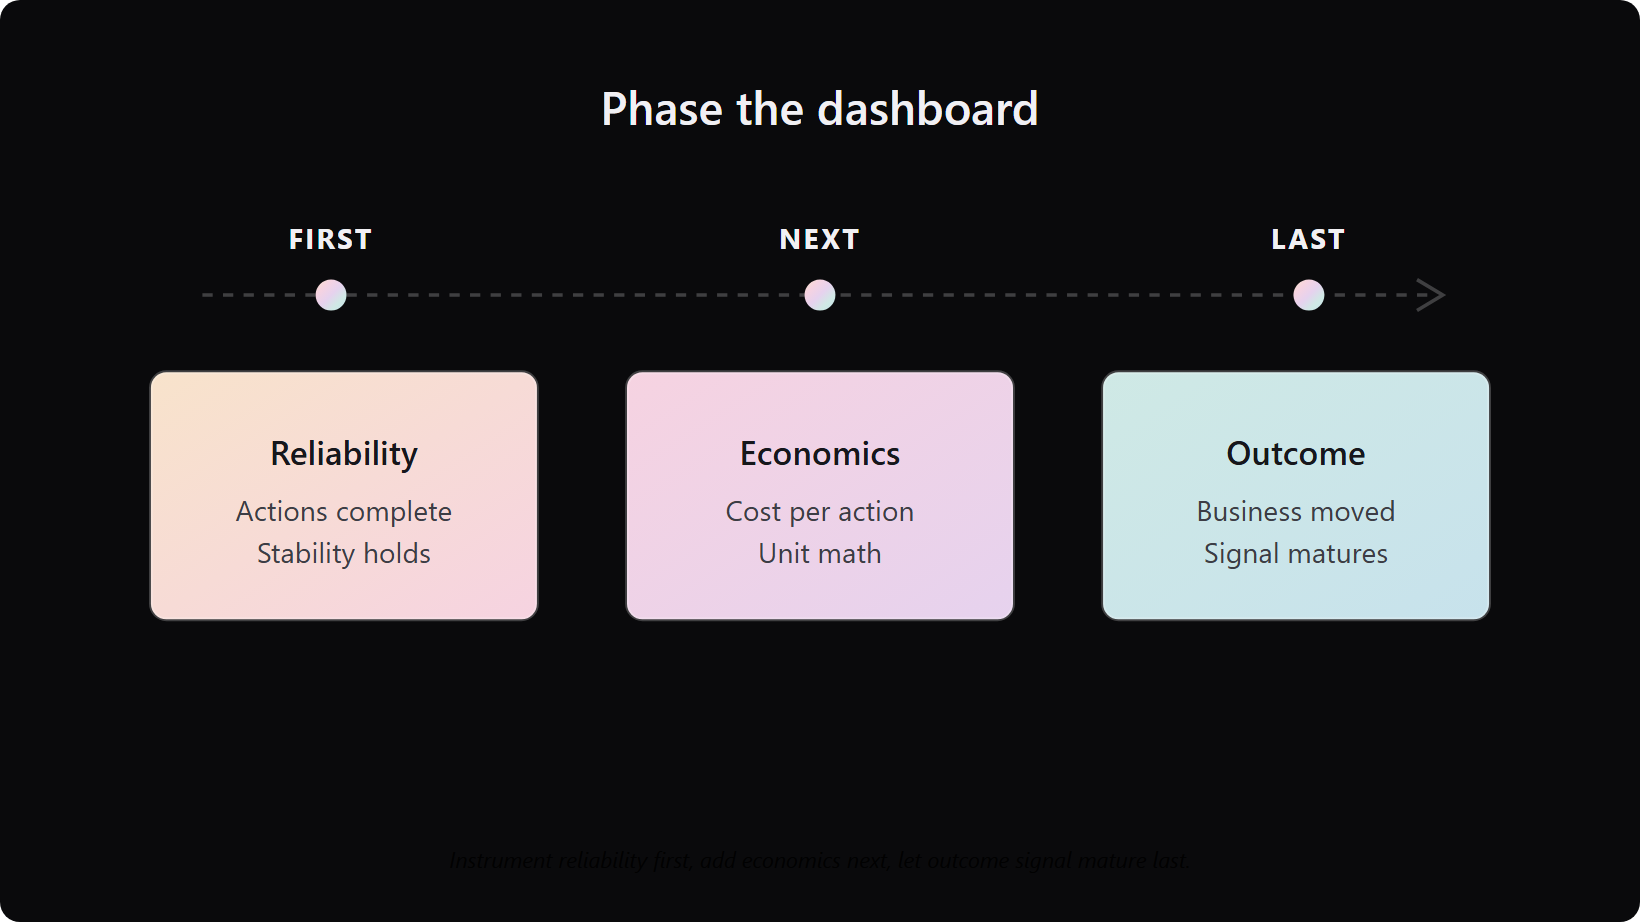
You cannot light up all four tiers at once. Trying to is how dashboards become fiction. Sequence them instead.
- Quarter 1. Instrument reliability. Can the system complete real actions safely?
- Quarter 2. Add economics. What does each completed action actually cost?
- Quarters 3 to 4. Outcome signal matures. Now you can claim business impact with a straight face.
The honest line for your board is this: reliable outcome signal takes two to four quarters, not two weeks. Anyone promising clean ROI sooner is showing you the demo again, and you read this whole article to stop falling for that. Our AI integration cost guide puts real numbers against that timeline.
🚪 Where this conversation goes next
The dashboard is the trust posture made concrete. Results over presentations, the work over the deck. I have watched this four-tier page turn a defensive board meeting into a planning one, because the numbers finally held.
If your pilots are stalled somewhere between read-only and write-access, that is the conversation we have at Teamvoy almost every week. The honest first step is small: a 3-to-5-day audit that surfaces your risk surface and a prioritized plan, not a finished implementation. Where my view sits right now is that the teams who win the next two years are the ones who measure the boring tiers first. If that sounds like your situation, the door is open through our contact page.